

(FREE) Maximize Profits with SMB Financial Benchmarking, Part 1
(FREE) Maximize Profits with SMB Financial Benchmarking, Part 1
How do you stack up? Where to find info. Making sense of the benchmarks

Commentary directly from the video (regular type)
My commentary (italics)
It took a while to create a spreadsheet for this video and find up-to-date sources for benchmarking information. I wasn’t able to make my typical Monday deadline. Part 2 WILL be ready next Monday, April 17.
Additionally, the scope of this video is a bit broad and the last couple of minutes are somewhat vague/rushed. So, I limited my commentary/analysis to the first 8:20. There will be two more videos covered in the series on financial ratio benchmarking.
Enough excuses…here’s the newsletter.
Intro
A small business’s financials are often a mystery to them. Most owners aren’t financial managers - they only have a basic understanding of their financials. That’s why you’re here…maybe? To better understand your finances?
Since they have a limited understanding of their finances, owners have no idea how they perform relative to the competition. They also have little idea what a banker (lender) would think of their creditworthiness. A small business might know how they compare to the competition in terms of price, customer perception, and other easy-to-find metrics. What they typically DON’T know, however, is how well their business is run (internally) relative to the competition.
A spreadsheet-based tool where you can compare your financial ratios with industry averages will give you an idea of where your small business stands. Additionally, if you can find benchmark data for companies that are of a similar size to you - that would also be helpful. Benchmarking financial ratios has several benefits, including:
Identifying strengths and weaknesses
What strengths can you leverage? What weaknesses must you improve?
Setting goals
Where are you? Where do you want to be?
Identifying best practices
What do your peers know that you don’t?
Decision making
Are you earning an adequate ROI? Do you need to cut costs?
Securing financing (as mentioned above)
Show off the strengths of your business compared to others like it.
Additionally, knowing where you stand among your peers could help you when you perform a SWOT (Strengths, Weaknesses, Opportunities, Threats) analysis, for instance. Here is an in-depth resource I wrote about SWOT analysis. It was written for churches, but the principles apply to all organizations.
Speaking of banks, they use two primary sources for industry financial ratio data:
RMA (Risk Management Association)
Designed for banks. Has a focus on loan underwriting.
First Research
Potentially accessible through colleges and public libraries.
As you’ll see in Part 2, I recommend a few other resources (some free, some paid) for industry financial ratio data.
His spreadsheet
The author’s example spreadsheet has separate sections for:
Income statement accounts
Revenue
Gross margin
Officer compensation
Advertising and sales
Other operating expenses
Operating profit
Net profit
Balance sheet accounts
Cash
Accounts receivable (AR)
Inventory
Total current assets
Property, plant, & equipment
Other non-current assets
Total assets
Accounts payable (AP)
Total current liabilities
Total long-term liabilities
Net worth (equity)
Financial ratios
Quick ratio
Current ratio
Current liabilities to net worth
Current liabilities to inventory
Total debt to net worth
Fixed assets to net worth
AR days
Inventory turnover
Total assets to sales
Working capital to sales
The financial ratios are used to gauge the health of the company. Financial ratios are (typically) built off of information in the income statement and balance sheet.
Most businesses think in terms of dollars. NOT ratios or percentages. In financial analysis - dollar amounts matter AND percentages/ratios matter. Each is used to get a unique perspective on your finances. Percentages/ratios allow for a comparison when dollar amounts are different.

His spreadsheet also uses another source for local averages - a website called Size-Up.com. That website is now: https://company.sizeup.com/.
Here, you can find a Net sales (revenue) number for businesses in a particular city/county. Then, based on the percentages from First Research (or RMA) the spreadsheet will calculate the remainder of the income statement and balance sheet accounts (and, consequently, the ratios). He says that SizeUp is free. Which..might have been true when this video was made (8+ years ago). But, that is no longer the case.
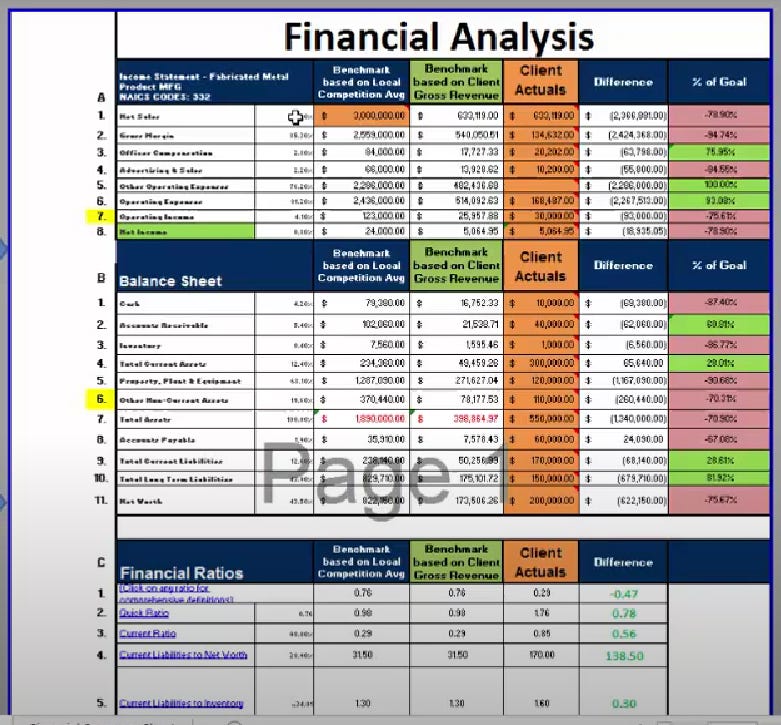
Here’s a breakdown of how his spreadsheet is laid out:
Column 1, Accounts & ratio names
Column 2, Percentages
Source = First Research
Column 3, Local dollar benchmarks
Median Net sales (revenue) for businesses in your industry and your area
“Perfect financials” for the competition
Derived from the percentages in Column 2 and Median Net sales (revenue)
Your “goal”
Source = SizeUp
Column 4, “Perfect financials” for your company
At its current size
Calculated
Column 5, Your actual financial data
Source = your financial statements OR Schedule C
Column 6, Difference
Column 5 - Column 3
Your distance from the “perfect financials for the competition” in dollars
Column 7, % of goal
Column 6 / Column 3
Your distance from the “perfect financials for the competition” as a percentage
I created my own version of this spreadsheet. Here is a link to that. Look for a walkthrough/explanation in next week’s newsletter.
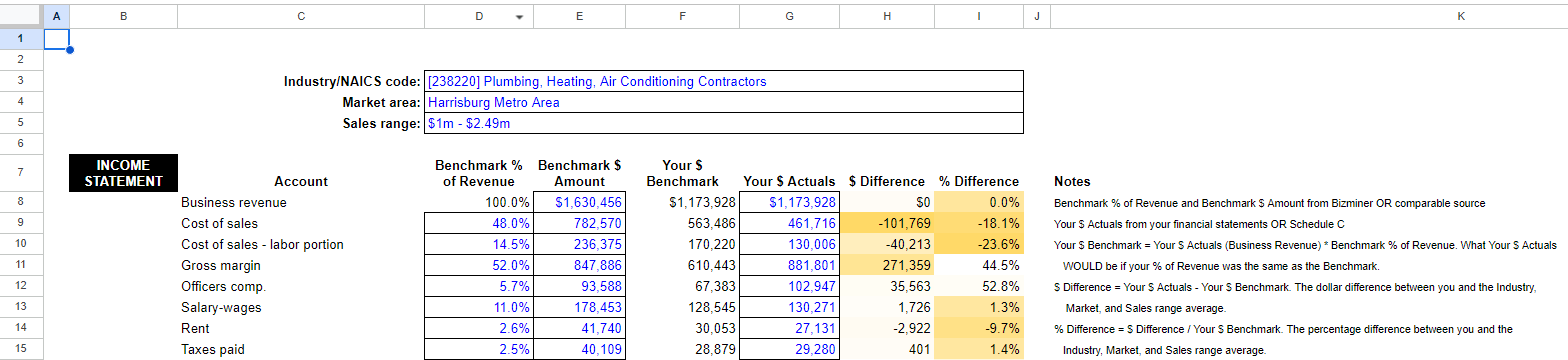
I’m admittedly biased. But, I think my spreadsheet is easier to understand and fill in. I think it also makes better comparisons (Your actuals to YOUR Benchmark).
In his example spreadsheet, the user would:
Enter percentages into Column 2 for each account
Enter the Median revenue for a business in your industry and area in Column 3
Enter your actual amounts for each income statement and balance sheet account in Column
This allows for the comparison to be made between your financials and the information from the First Research (or RMA) and SizeUp.
If you don’t keep the greatest financial records, then you might refer to your Schedule C tax form. Everyone that is a sole proprietor or LLC has to fill this form out on their taxes Source.
If your business is a multi-member LLC or partnership, you might refer to Form 1065 Source.
If your business is a corporation, you might refer to Form 1120 Source.
Obvious disclaimer - none of this is tax advice…consult your tax professional…yada, yada, yada… Better yet - keep good financial statements OR employ a bookkeeper who will.
Most business owners may not have the expertise to analyze their financial statements or the benchmarking analysis he demonstrated. Therefore, graphing the results of the ratio benchmarking analysis is important to provide context.
Charts & graphs
This allows you to see what those benchmarks look like. And, how your business compares to them. He uses radar charts (which I don’t think do a great job of illustrating) and column charts for these visualizations.
If the benchmark is the goal - these charts show where your company stands in relation to the goal.
Benchmarking is a VERY important thing to do. However, many business owners won’t have the expertise to understand the information in a tabular format. They may if it is presented graphically, however. Stay subscribed to SFBB and you WILL have the expertise!

Read more about financial benchmarking in Part 2:

Comment below
Which of your accounts or ratios are you most curious to see stacked up against the competition?
Have you benchmarked your financials or ratios before? What surprised you?