

(FREE) Maximize Profits with SMB Financial Benchmarking, Part 2
(FREE) Maximize Profits with SMB Financial Benchmarking, Part 2
Navigating the spreadsheet. Data sources. Best practices.

Commentary directly from the video (regular type)
My commentary (italics)
This newsletter is a bit unique, in that, it won’t have much video commentary. That was addressed in Part 1. Read that here:

In this newsletter, I’ll expound on the spreadsheet I created for financial ratio benchmarking. PLUS, I’ll outline some of the sources for financial benchmarking data I found while researching this subject.
My spreadsheet
Since the video creator doesn’t provide a link to his spreadsheet. I created my own FREE version for my readers to use.

There are some important distinctions to outline:
Benchmark % of Revenue (Total assets)
This is the average percentage of revenue (or total assets on the balance sheet) for the accounts listed in the industry, market area, and sales range (company size) specified.
I suggest using Bizminer for this data. More on Bizminer below.
I chose Bizminer because I felt their reports were easy to read (and copy + paste). Also, you can find percentage AND dollar (Benchmark $ Amount) data side by side. No need to pull from two separate sources.
The video creator suggested First Research. If you can access First Research for free at your local library or university - then, by all means, use it. My library did not offer access.
Other than the source of information - this field is essentially the same as his. No percentages were pulled for ratios, however.

Benchmark $ Amount
This is the average dollar amount for the income statement and balance sheet accounts listed in the industry, market area, and sales range (company size) specified. These dollar amounts will correspond with the Benchmark % of Revenue (Total assets).
Again, Bizminer will provide both the percentage and dollar amounts.
The video creator referenced a service called SizeUp for the revenue (Net sales) amount. After entering that, the remainder of the accounts would calculate based on the percentages in his Column 2.
That’s another reason I don’t like pulling from two separate sources - who’s to say if the industries, market areas, and sales ranges match up between First Research and SizeUp? By using one source, Bizminer, you can be sure.
Again, sources of information aside, this field on my spreadsheet is essentially the same as his Column 3.
Your $ Actuals
Yes…I skipped the Your $ Benchmark field. That’s because I tried to keep the format somewhat consistent with the video creator’s spreadsheet. Also, these first three columns are the ones that require your input - so they’ll be the ones you address first.
This field is pretty self-explanatory. Enter your financial information for each account (for an entire year).
Your chart of accounts may or may not coincide with Bizminer’s. Get help from your bookkeeper/accountant. Or…make your best guess about which accounts to combine/split out to best match Bizminer’s account structure.
Your $ Benchmark

This field takes your Business revenue (Total assets in the Balance Sheet) and adjusts every other account to the appropriate Benchmark % of Revenue (Total Assets).
For instance, if your Business revenue is $1,000,000 and the Cost of sales Benchmark % of revenue is 50%, then Your $ Benchmark for Cost of sales will be $500,000 ($1 million × 50%) for the purposes of comparison.
This field is what your account balances would look like if your Benchmark % of Revenue (Total Assets) was the same as the industry average.
This is what the video refers to as your “perfect” financials.
Yes, we are using this field as a benchmark against which you can compare your company’s performance. But, these amounts are based on what the average company in your industry, market area, and sales range (size) is doing. And, “average” is rarely perfect. So…take that with a grain of salt…
$ Difference
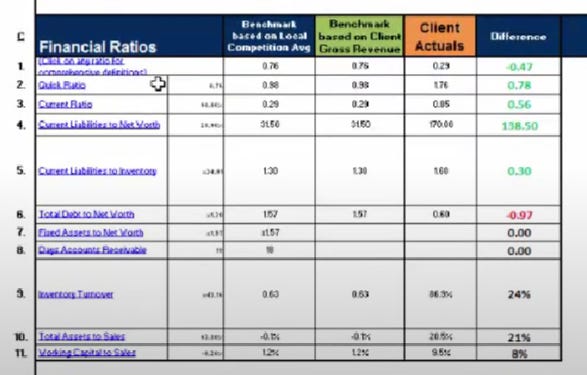
Okay, here’s where my spreadsheet starts to really diverge from the one in the video.
He compares Client Actuals (Column 5, Your $ Actuals) to the Local Competition Avg (Column 3, Benchmark $ Amount).
I compare Your $ Actuals to Your $ Benchmark. The field that adjusts Your $ Actuals to match the Benchmark % of Revenue.
To me - it doesn’t make sense to compare your business to an average business that may be of a considerably different size. Even if it’s in the same Sales range.
Those ranges can be pretty big. If your business has $1 million in Business revenue, it probably won’t (and shouldn’t) have the same Taxes paid, Advertising, and Rent as a business with $2.49 million in Business revenue.
By the way, you can learn more about what percentage of revenue you should spend on advertising here:
The same holds true for the Balance Sheet. The amount of Cash you’re holding probably won’t be the same as a business that is 2.5x the size of yours (or, 40% the size of yours, for that matter).
Additionally, I added some custom formatting to highlight where your $ Difference was biggest.
% Difference
Same principles apply here.
I compare your $ Difference to Your $ Benchmark. This is the percentage above or below that your company is from where it would be if your Benchmark % of Revenue was the same as the competition in a given Industry, Market, and Sales range.
He compares the Difference (Column 6) to the Local Competition Avg (Column 3, aka Benchmark $ Amount).
Here too, custom formatting is added to highlight the biggest % Differences.
HOPEFULLY…that all makes some sense!
Ratios
Bizminer has a lot of ratios. All of these are grouped into 4 categories:
Cash flow-solvency
Profitability
Efficiency
Cash debt risk

For each category, I included the, arguably, most important ratios in my spreadsheet. That’s not to say the excluded ratios aren’t important. As I mentioned in last week’s newsletter, the scope of the video and newsletter got to be a little bigger than anticipated. So, cuts had to be made somewhere…
Here’s what I DID include:
Current ratio
Measures a company's ability to pay its short-term liabilities with its short-term assets.
Days payable
Measures how long it takes a company to pay its accounts payable.
EBITDA to business revenue
Measures a company's operating profitability as a percentage of its revenue
Pre-tax return on net worth
Measures a company's ability to generate profits using the capital invested by its owners
Gross margin to business revenue
Measures the profitability of a company's products or services by comparing its gross margin to its revenue
Sales per employee
Measures a company's productivity by calculating its revenue per employee.
Total asset turnover
Measures a company's efficiency in using its assets to generate revenue.
Interest coverage
Measures a company's ability to pay its interest expenses on outstanding debt.
Modified Z-score
Measures a company's financial distress or bankruptcy risk.
Even with some ratios left off, my spreadsheet still offers more than the spreadsheet in the video. If you’re handy with spreadsheets, you can add rows for more ratios. As long as you know how to calculate them.
As with the Income statement and Balance sheet accounts, my Difference fields compare Your Actual Ratio to Your Benchmark Ratio.
The video’s spreadsheet compares Client Actuals (Your Actual Ratio) to the Benchmark based on Local Competition Avg (Benchmark Ratio).
If you read my explanation above - you know why I chose to make the comparison I did.
Also, his spreadsheet doesn’t have a % Difference field. Which, I suppose I can understand. I chose to copy this field down from the account comparisons above for the sake of completeness.
Charts
Here, I copied the video spreadsheet’s column charts but omitted the radar chars. As I mentioned last week, I just didn’t think that they illustrated the data well.

Anyhow, I’ve been a little critical of Ray Bowman’s spreadsheet throughout the past couple of newsletters. I AM, however, very appreciative of his video and for laying the groundwork for my newsletters and spreadsheet.
Benchmarking data sources
There is surprisingly fewer small business benchmarking sources of information than you would think.
It’s the sort of thing that I would assume the Census Bureau or some other government entity would make available for free. Alas, that’s not the case.
Here is a quick rundown of the resources I WAS able to find - if you’re interested in delving more into benchmarking your small business:
RMA

$185 per report
Somewhat difficult to read
First Research (Dun & Bradstreet)
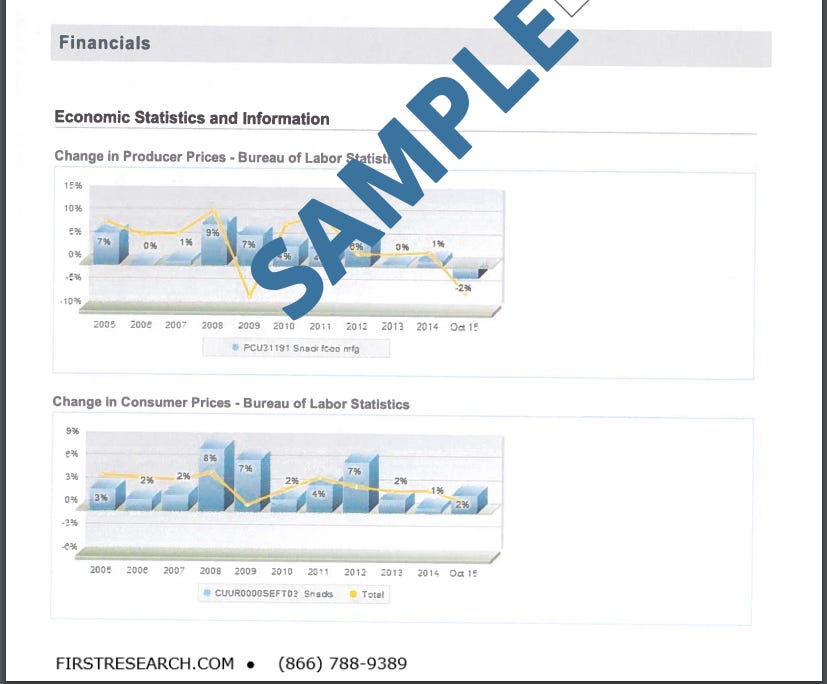
$129 per report
More narrative in nature than data-centric
SizeUp
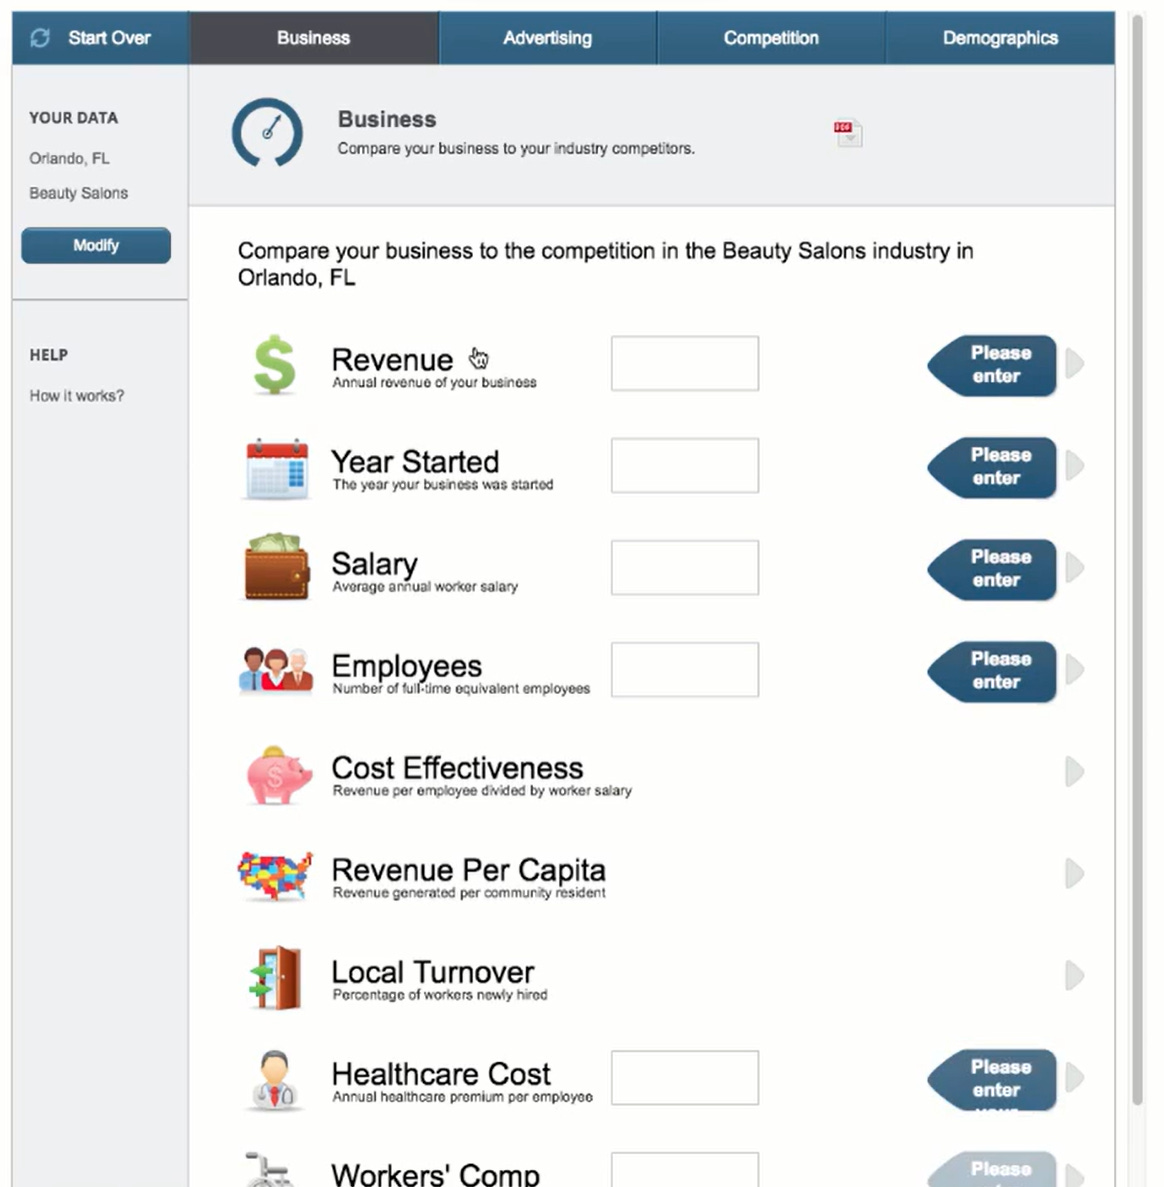
Cost unknown
Primarily sold to local governments. Who, in turn, make it available as a public service?
Limited benchmarking information compared to other options
But…some unique information too such as competition and advertising
Some locales may offer access to this tool
Search “[location name] SizeUp Business Intelligence”
Bizminer
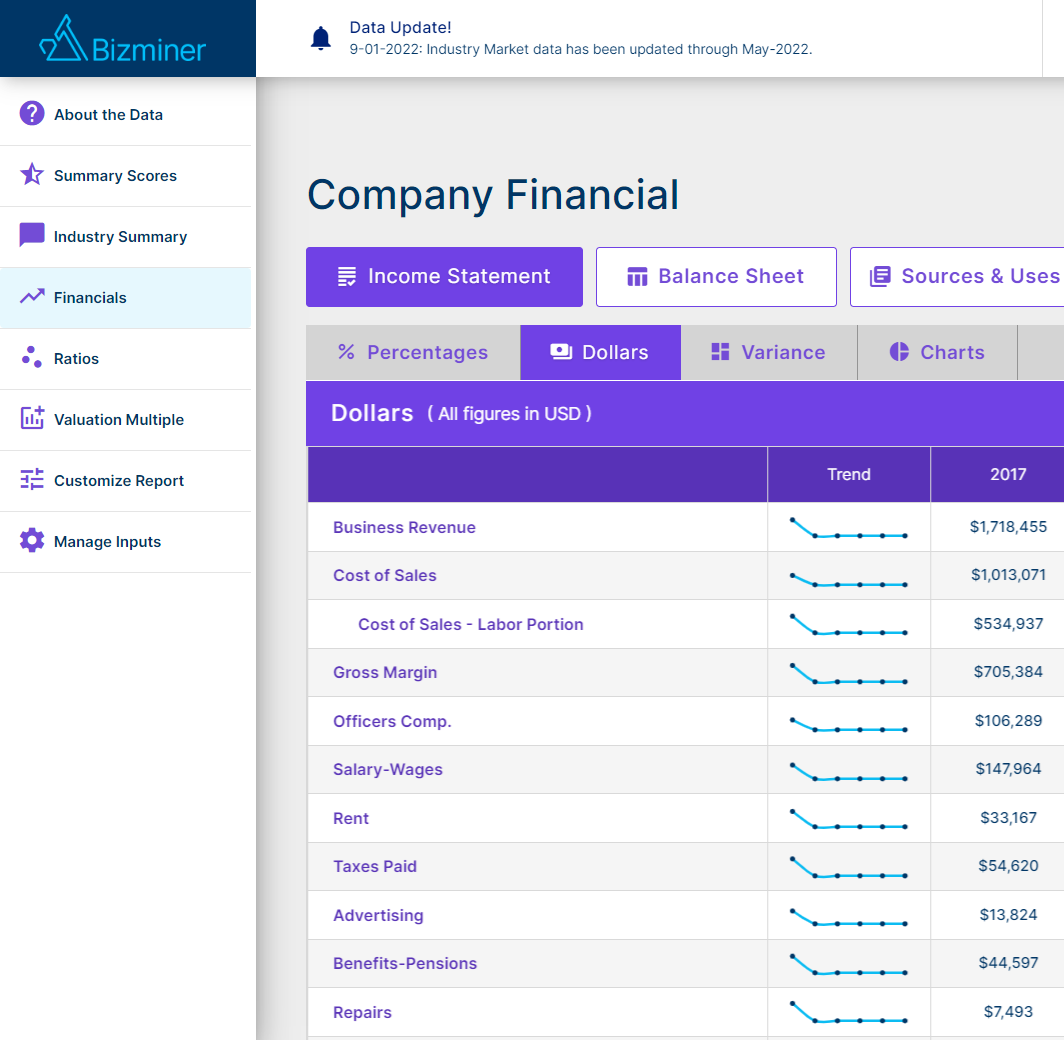
$249 per report
My recommendation
BizStats
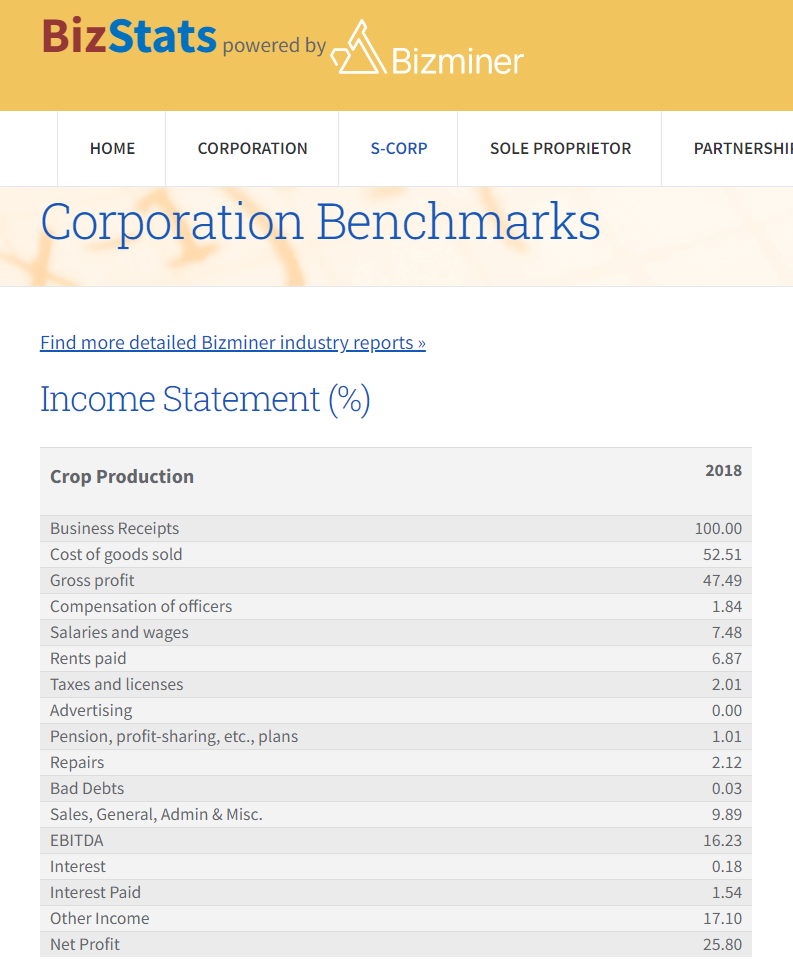
Free
Limited and dated information
Possibly a good option if you’re just getting started or curious about benchmarking
Comment below
Do you know of any better (or cheaper) resources for benchmarking data? What are they?
In what other ways are you curious about how you stack up to the competition??