

(FREE) Industry Benchmarking: Creating Realistic Projections, Part 1
(FREE) Industry Benchmarking: Creating Realistic Projections, Part 1
IRS data goldmine. Every sector/industry. Percentage of revenue.

Commentary directly from the video (regular type)
My commentary (italics)
These benchmarking posts are challenging to translate into coherent posts and spreadsheets. So, this post, like the one before it, is split into Part 1 and Part 2. Part 1 will focus on the IRS data. Part 2 will focus on making that data useful via a spreadsheet.
Introduction
How can you know that your financial projections are realistic? A good way to ensure this is to compare your projections to industry averages. Benchmarking isn’t just good practice for looking at the past. It can also help you budget and forecast for the future.
It can be difficult to find a reliable source for industry data. I’ve found this to be true too. In addition to what’s linked in this newsletter, check out my previous post where I listed a few resources for industry benchmarking:

The IRS sole proprietor tax return data can be used to provide benchmarks for projections.
Here is where that information can be found: Link
This data requires some “cleanup” in order to be truly useful. Again, by adding this industry data to your financial projections - you can find out if your numbers make sense. By comparing your projections to an industry average, you can “feasibility test” your projections. For instance, if you think that you will have a gross margin of 65% when your industry’s average is 30%, you either have a vastly superior business model or…you’re setting unrealistic expectations for yourself.
IRS benchmark data

Financial projections for the restaurant industry are used in the video.
The IRS produces and publishes tax return data from sole proprietors in the U.S. annually. In this example, the video references data from 2019. The assumption is that data from 2020 and 2021 could be skewed due to the effects of Covid. In my FREE spreadsheet (Industry Benchmarking: Creating Realistic Projections), I used 2020 data.
Again, the IRS data can be found HERE.
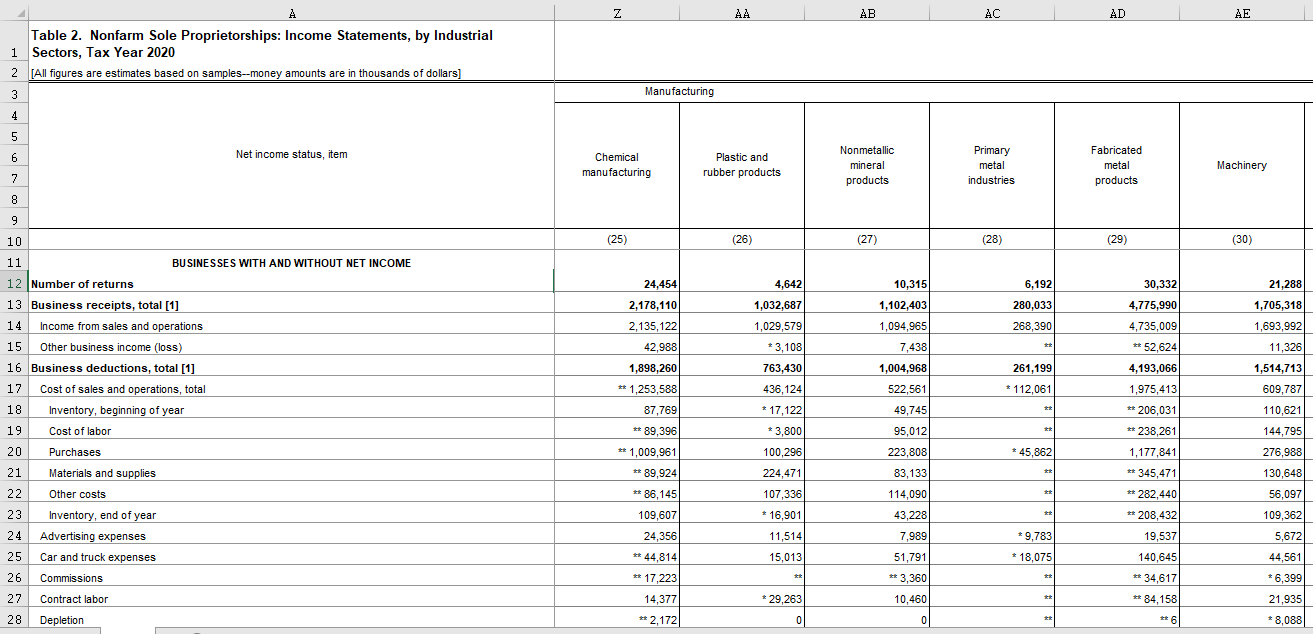
What you’re looking for here is the Income Statement section. Select the year you want. Files are in .xlsx (Excel) format.
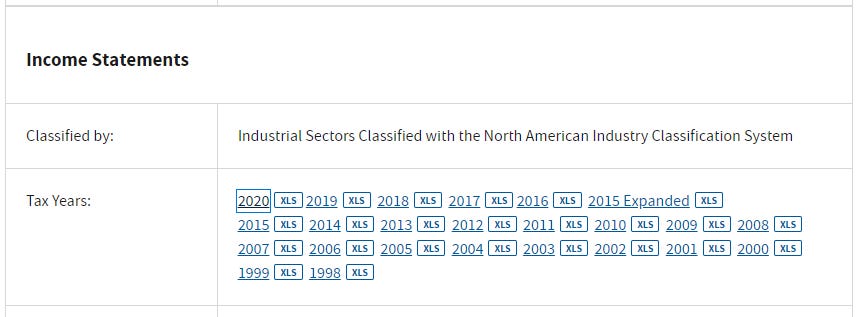
In the Income Statement spreadsheet, you’ll find a lot of columns, each representing a diverse assortment of sectors and industries. There are 150 in total.
As far as the other options on the IRS website, here’s what they contain:
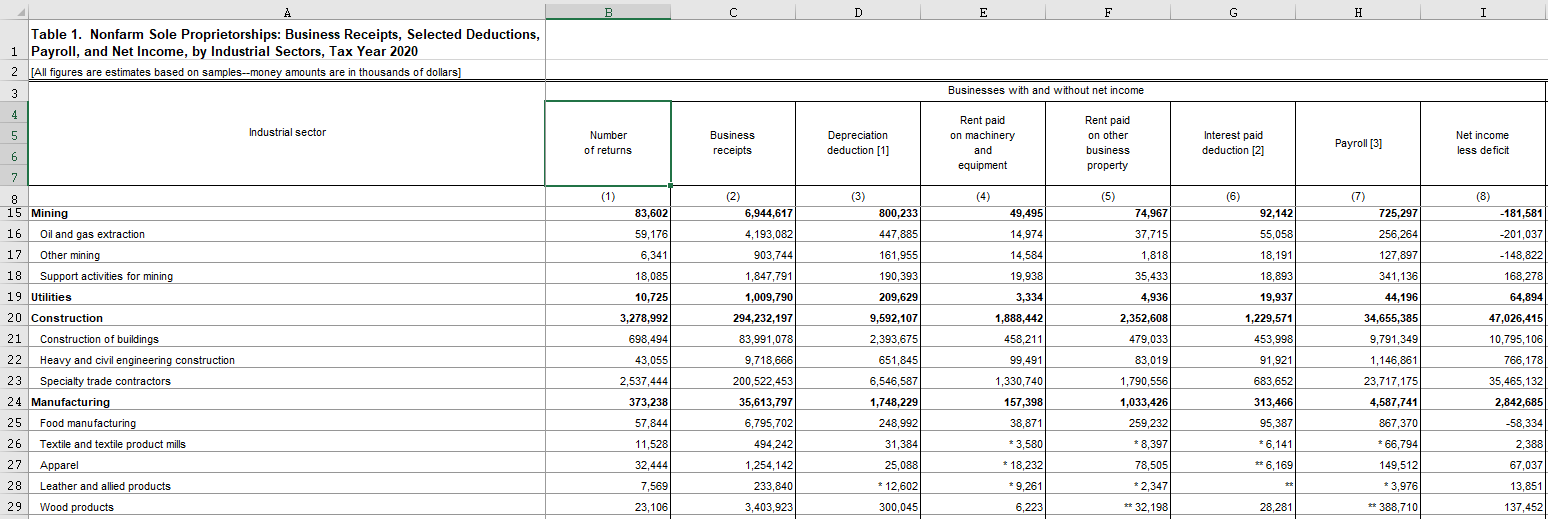
Business Receipts, Selected Deductions, Payroll, and Net Income
“...01br.xlsx”
These spreadsheets include a lot of the same major accounts included on the Income Statement. However, the columns and rows are switched around.
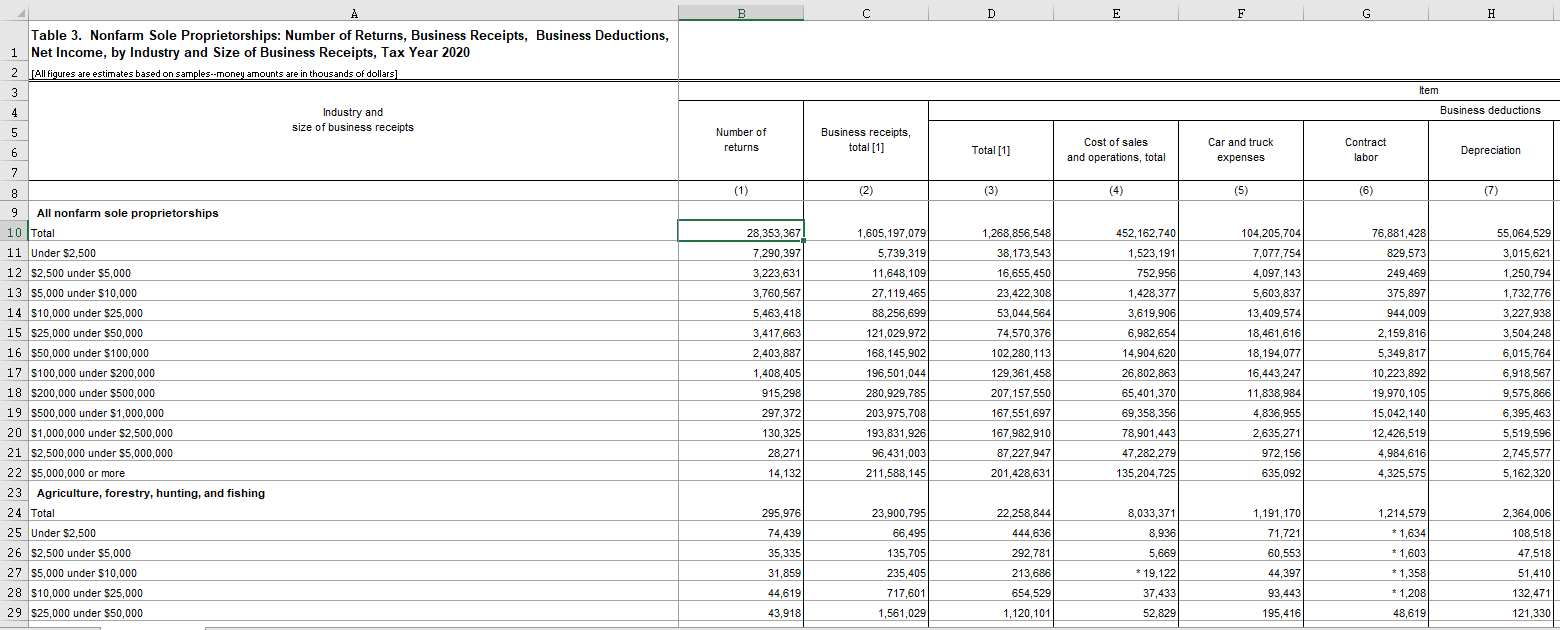
Business Receipts, Selected Deductions, and Net Income
“...03szbr.xlsx”
These spreadsheets break the sole proprietorship businesses down by size. Each sector is broken into categories based on the amount of business receipts.
Returns with Schedule C Attached: Income Items, Adjustments, Credits, and Taxes
“...04ra.xlsx”
These spreadsheets break down more-detailed tax return information by:
Marital status
Age
Industry
The data here is probably too granular for your projection benchmarking needs. You’ll likely find what you need in the Income Statements spreadsheets (or one of the other two).

On the left-hand menu of the IRS web page (Tax Statistics), you’ll also find links to spreadsheets with data on partnerships and (S) corporations. Those, however, are beyond the scope of this newsletter.
The IRS data, as is, requires a little bit of cleanup/calculation before it can be useful for projection benchmarking.
Calculating benchmarks
Information in the IRS Income Statement spreadsheet is listed as the total for all businesses. So, you’ll need to divide those amounts by the Number of returns to get the average amount for each row.
You’ll also want to divide the expense accounts by revenue (Business receipts, total) for the purposes of benchmarking your projections. This is called a “common-size” income statement - everything is represented as a percentage of revenue.
The FREE Industry Benchmarking: Creating Realistic Projections spreadsheet will automatically calculate average benchmarks for the industry you select AND the percentage of revenue. On the Sector/Industry Selection tab - select the INDEX NUMBER for the sector/industry you are interested in (from the IRS Income Statement tab, highlighted row).
The IRS Data numbers in the Sector/Industry Selection tab are actuals, NOT in thousands of dollars as they are on the IRS Income Statement tab.


Comment below
Were you surprised by the average % of Revenue for your industry?
What are you making financial projections for? Budgeting, a capital project, cash flow, something else?